
Different AI tools named a different top pick in 78.3% of the 276 buying prompts we asked to more than one engine. A visibility report built on one tool is therefore reporting one result set and calling it the category.
The case for that approach is simple: measure tool by tool, because the same buyer wording produces a different winner across the major AI engines. Citedintel's October 2026 research also shows that recommendation share is spread across brands rather than held by a leading few, and that the evidence behind recommendations comes from a far wider base than review sites and community threads: 2,543 domains, of which review platforms supplied 1.6% of citations and community sources 1.1%.
Winning in one AI tells you almost nothing about the others
Different AI tools selected different top picks for 78.3% of the 276 prompts asked to at least two engines. The result comes from a mixed set of answers: 72.3% consumer brands, 21.9% business software, 4.1% services and other, and 1.7% software sold through partners.
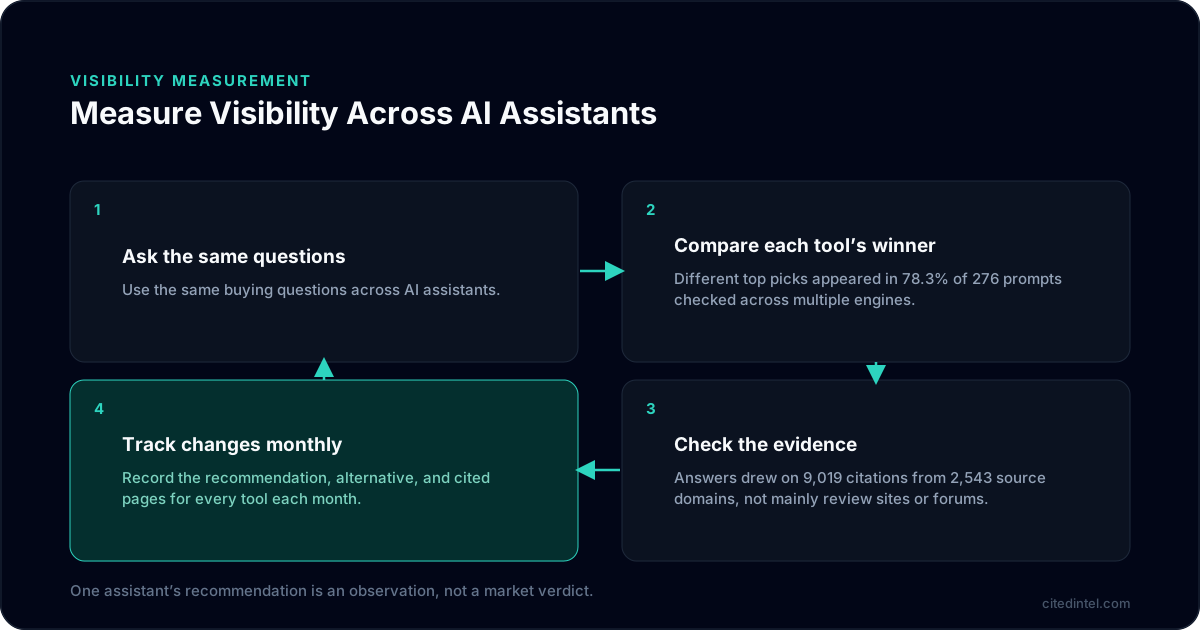
For a brand marketer, the useful question is not simply whether the brand appears in an answer. The stronger question is whether the brand stays visible when a shopper asks the same category question through another AI tool.
My view is that one AI tool gives you a useful observation, not a market verdict. A brand that treats one tool's top recommendation as category leadership is making a claim wider than this dataset supports.
| Observed result | What sits behind it | Working implication |
|---|---|---|
| Different top recommendations | 78.3% of 276 prompts checked across multiple engines | Compare AI tools before choosing a visibility priority |
| Recommendation share held by the top three | 20.0% average across 8 measured categories | Track distribution, not only the leading result |
| Sources cited in answers | 9,019 citations from 2,543 source domains | Review the breadth and usefulness of public evidence |
The figures in the table come from the same mix of answers. The data does not show whether business software had a higher or lower disagreement rate than consumer brands by tool, so the 78.3% figure should remain a headline result rather than a category-specific ranking.
That limitation points to a reporting requirement. A useful monthly record should keep the shared prompt, the AI tool, the category, the top pick, the alternatives, and the evidence shown with each recommendation. Without those fields, a report can show that visibility changed without showing where or why.
The leading brands hold a fifth of recommendations. The rest is up for grabs
Across 8 measured categories, the top three brands received an average of 20.0% of recommendations. The data behind that result contained 72.3% consumer brand answers, 21.9% business software answers, 4.1% services and other answers, and 1.7% software sold through partners answers.
For a brand team, the 20.0% figure argues against using one leading answer as the whole competitive picture. The remaining recommendation share sits beyond the top three, leaving room for challenger brands to appear against particular shopper needs even when they do not lead broad category prompts.
The data does not show the full spread among brands outside the top three. It cannot say whether that remaining share is evenly spread or concentrated among a second group. It does show that the measured categories were not represented by three brands taking nearly all recommendations.
That changes the reporting question. Ask which brands appear for which needs, which tools select them, and which sources support the selection. "Who won?" is too blunt to guide the next content or evidence decision.
What to track every month to know if you are being recommended
- Prompt coverage: Record whether a brand appears for category, comparison, ingredient or material, concern, and fit questions.
- Tool spread: Save the AI tool beside every result instead of combining all responses into one score.
- Recommendation position: Distinguish a top pick from an alternative and from a passing mention.
- Supporting evidence: Keep the sources shown beside the recommendation and the buying fact each source supports.
These fields help a brand find a narrower opening. A brand may be absent from a broad category response but present when the prompt adds skin type, foot width, sleep position, or dietary requirements.
The same discipline matters across countries and languages. A brand may lead in its home market and receive a different answer elsewhere. The October dataset does not include a country cut, so teams should capture market and language as prompt fields instead of guessing at regional behavior from the headline numbers.
Review sites barely feature. AI builds its case from thousands of ordinary pages
The audit examined 9,019 citations from 2,543 distinct source domains. Review platforms represented 1.6% of citations, while community sources represented 1.1%, across the combined set of consumer brand, business software, services and other, and software sold through partners answers.
The finding gives content teams a useful correction: being cited in AI answers is not the same as being visible on review sites. Reviews and community discussions can contribute evidence, but the citations we analyzed came from a much wider set of public domains.
A brand should inspect the complete evidence path behind a recommendation. The relevant source may be a product page, a retailer listing, press coverage, a comparison article, or another public domain. The data supplied for this article does not name individual domains, so the responsible action is to audit the source list rather than guess which source type matters most.
My view is that a visibility program built around one source type is too narrow. A product page can explain what the product does, while an independent source may supply the comparison language that helps an AI tool tell one option from another.
Four questions to ask about every page AI cites about you
- Claim match: Does the page support the particular claim shown in the answer?
- Page role: Is the source explaining the product, comparing options, describing ingredients or materials, or describing fit?
- Source breadth: Does the evidence come from multiple domains or rely on a small set?
- Current details: Does the page still reflect the product, price, range, and availability as of October 2026?
Say, for a skincare brand, the review may center on ingredient claims and dermatology mentions. For a footwear brand, the review may center on sizing, materials, and fit guidance. The source question stays practical: can a shopper verify the recommendation without relying on the generated answer alone?
Recommended brands show up in four more places than ignored brands
Digital PR was present for 33.3% of top-recommended brands, review presence for 32.9%, social video presence for 22.0%, and marketplace presence for 20.4%. These are patterns seen among top-recommended brands, not proof that any one signal caused a recommendation.
The gaps against rarely recommended brands were 13.2 percentage points for digital PR, 12.3 for review presence, 10.2 for social video presence, and 9.3 for marketplace presence. The figures come from the same mixed set of answers, and the data does not divide these signals by business software, consumer brands, services and other, or software sold through partners.
| Signal | Presence among top-recommended brands | Difference versus rarely recommended brands | Review focus |
|---|---|---|---|
| Digital PR | 33.3% | 13.2 percentage points | Independent coverage of the category, product, market, or expertise |
| Review presence | 32.9% | 12.3 percentage points | Shopper language, strengths, limitations, and category placement |
| Social video presence | 22.0% | 10.2 percentage points | Public explanations of product use, fit, and proof |
| Marketplace presence | 20.4% | 9.3 percentage points | Structured product and brand information on relevant marketplaces |
The implication is to treat off-site evidence as part of your visibility work rather than as a separate brand activity. A product page may explain a feature, while an independent review or marketplace listing supplies the language about comparison, fit, or limitations.
Say, for a mattress brand, review presence may need to clarify firmness, trial periods, and return policy. For an appliance brand, public evidence may need to explain warranty terms, capacity, and compatibility. The headline numbers do not support a category forecast, so each team should inspect these signals inside its own prompt set.
Social video needs a precise reading. The result does not show that publishing video by itself creates recommendation share. It shows that social video presence was more common among top-recommended brands than among rarely recommended brands overall. The next check is whether the video makes a product claim or buying fact available in a form other public pages do not.
Digital PR also needs a buying-question brief. A general announcement can create public visibility without helping an AI tool tell products apart. A stronger brief identifies the category statement, feature, market fact, or shopper problem that external coverage should make verifiable.
What this means for a consumer brand
Business software represented 21.9% of the segmented set, while consumer brands represented 72.3%. The overall findings therefore carry a strong consumer weighting, so any brand should use the headline numbers as direction and validate the pattern within its own category and prompt set.
Broad 'best brand' questions and specific questions behave differently
A brand should separate category prompts from evaluation prompts. Category prompts test broad association, while evaluation prompts test whether a product fits a shopper with a particular need, skin type, budget, or use case.
The 78.3% multi-engine disagreement rate makes that separation more valuable. If one tool recommends a brand for a general question and another selects a different brand, compare the reasoning and supporting evidence in both answers before changing the website.A marketer working on a packaged food brand can use the 20.0% top-three result to prioritize distinctive buying questions. The opening may sit in dietary needs, ingredient sourcing, or portion formats, provided the company can publish proof for the claims it wants AI tools to repeat.
Most of the answers we studied were about consumer brands
Consumer brand answers represented 72.3% of the segmented set, with 5,982 answers. Consumer teams should read the citation results alongside product and marketplace information, rather than treating editorial coverage as a substitute for accurate product details.
A skincare or home and kitchen brand can check whether public sources describe the same attributes as the product page. The relevant review concerns use, fit, specifications, limitations, and availability. The data does not include a product-category cut, so teams should not turn a signal rate into a forecast for a particular consumer category.
Small categories need their own check
Services and other represented 4.1% of segmented answers, with 340 answers. Software sold through partners represented 1.7%, with 140 answers. Those samples are too narrow here to support broad conclusions about recommendation behavior.
A services brand should still capture its own AI tool and prompt results. The small share here is a scope note, not a reason to ignore AI visibility. It means the brand needs a category-specific review before prioritizing digital PR, reviews, social video, or marketplace presence.
Start a one-page check this week
Create one row for every shared buyer prompt and record the AI tool, top recommendation, alternatives, cited source domains, and buying reason attached to each result. The sheet turns a general disagreement percentage into a list of pages and external evidence to review.
- Select prompts: Choose category, comparison, ingredient or feature, concern, and fit questions for one of your categories.
- Keep wording fixed: Ask the same prompt across the tools your shoppers use. The study covered the major AI engines.
- Save the response: Record the top pick, other named brands, recommendation order, cited domains, and the sentence explaining the selection.
- Classify the gap: Mark each missing reason as category clarity, proof, comparison detail, feature detail, limitation, or external evidence.
- Choose a first repair: Select the gap that appears across more than one tool or blocks a high-value buying question.
- Repeat the comparison: Review the updated page and public source record against the original answers, without treating one changed response as a market-level result.
Use the October 2026 numbers as your reference point: 78.3% of shared prompts produced different top picks, while the top three brands averaged 20.0% of recommendations across 8 measured categories. Your sheet should show whether your category follows that pattern or differs from it.
Citedintel gives brand teams a way to turn this comparison into a recurring AI visibility programme, connecting answer audits with evidence priorities, editable content work, and rechecks across selected tools; see the AI search intelligence platform overview.
What this research covers and what it does not
Citedintel platform data, October 2026, covers a 28-day window and 8,985 analyzed answers from 2,735 distinct brands across 14 categories and 4 engines. The segmented mix included 5,982 consumer brand answers, or 72.3%; 1,809 business software answers, or 21.9%; 340 services and other answers, or 4.1%; and 140 software sold through partners answers, or 1.7%.
The research also examined 9,019 citations from 2,543 distinct source domains. The multi-tool disagreement result used 276 prompts asked to at least two engines. The recommendation concentration result covered 8 categories, and the signal comparison used top-recommended versus rarely recommended brands across the whole dataset.
The study reports observed patterns rather than proven causes. It does not show that digital PR, reviews, social video, or marketplace presence independently produces a recommendation, and it does not provide category-by-tool cuts for every finding. Teams should use the data to decide what to inspect, then validate the result against their category, market, language, and shopper questions.
Citedintel supports that way of working by giving brand teams a way to monitor how AI tools describe and recommend their brands, identify missing evidence, prepare content and external proof priorities, and report changes against a defined audit scope. The aim is not to claim that one tool speaks for the market. The aim is to see where shopper conversations diverge before those differences become missed consideration.
Early-stage teams can begin with Starter (free), while Pro is priced at $375 per month. Enterprise work is scoped around the market questions and tool coverage that matter to the program.
AI visibility starts with a disciplined comparison: keep the wording, separate the tools, inspect the evidence, and let the differences show where the category remains open.
Frequently asked questions
If my brand is recommended in ChatGPT, is it recommended everywhere?
Usually not. In 78.3% of the 276 buying questions we asked to more than one tool, the recommended brand changed across the major AI tools. Check each tool your shoppers use.
How many brands take most of the AI recommendations in a category?
Fewer than you would expect. Across 8 categories the top three brands averaged 20.0% of recommendations. The rest went to other brands, often for specific shopper needs rather than broad 'best brand' questions.
Do review sites decide which brands AI recommends?
Not on this evidence. Review platforms supplied 1.6% of the 9,019 citations and community forums 1.1%. The pages AI cited came from 2,543 different domains, mostly ordinary product, press and comparison pages.
What should a consumer brand track every month?
Ask the same shopper questions across the AI tools your buyers use. Record who was recommended, who was named as an alternative, and which pages were cited. Then fix the missing proof those answers point to.